
It’s Monday, and the plan is due. The numbers behind it describe last month. One person, usually the same one, spends the week rebuilding a spreadsheet only they understand and nobody quite trusts. Then the first question in the meeting is the one it can’t answer: what if?
The fix isn’t a better spreadsheet. The right data platform, supported by machine learning and AI makes planning automated, so the numbers refresh themselves; measured, so every forecast is tested against what really happened; explainable, so anyone can see what’s driving it; and flexible, so the next what if? takes minutes, not a week. And it’s open to the whole team, through the interface they prefer.
Automated
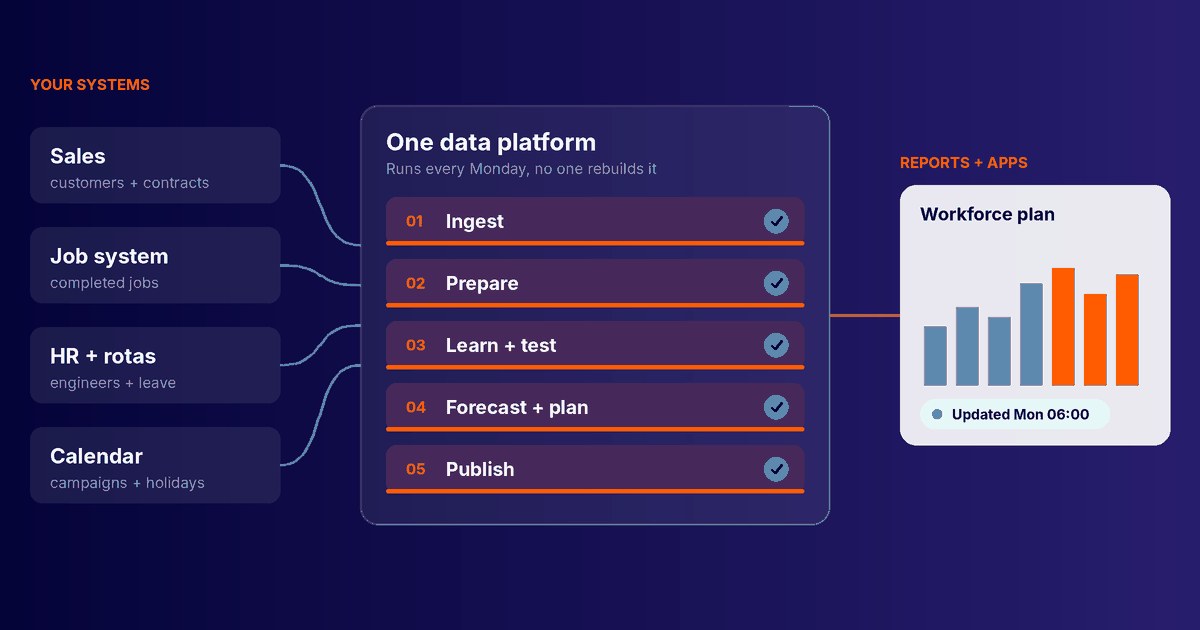
Planning data rarely lives in one place: customers and contracts in sales, completed jobs in the job system, rotas and leave in HR, campaigns in a shared calendar.
On the right platform, one scheduled process pulls them together every week. It ingests and prepares the data, retrains and tests the machine learning model, produces the forecast and plan, then refreshes the reports. Nobody rebuilds a spreadsheet, every run is logged, and every number traces back to its source.
Measured and continuously improving
A forecast is only useful if people trust it. So before anyone relies on the model, it is replayed against the past: a year of weekly forecasts, each made only with what was known at the time, then checked against what actually happened and against the manual forecast.
Each week new data arrives and the model retrains. A new version only goes live if it beats the one in use, so accuracy ratchets up instead of drifting.
Explainable
Every forecast breaks down into the reasons behind it, starting from the same week last year: seasonality, customer growth, campaigns, bank holidays and the unexpected.
That turns one number into something you can plan with. You see what you can change, like when a campaign runs. You see what you can’t, like the season, but can plan around. And you see what nobody can predict, so you hold a sensible buffer. Set against the rota, it shows where the gaps are and how big they are, weeks before they hit.
Flexible
Plans rarely survive the quarter intact. A hard winter, a fault in a product you service, a few engineers leaving: each one changes the picture.
So we work with your team to agree the scenarios that matter to you and build them in. Your team picks one and sees the extra hours, people and cost straight away, then decides what to do before it happens, not after.
Ask in plain English
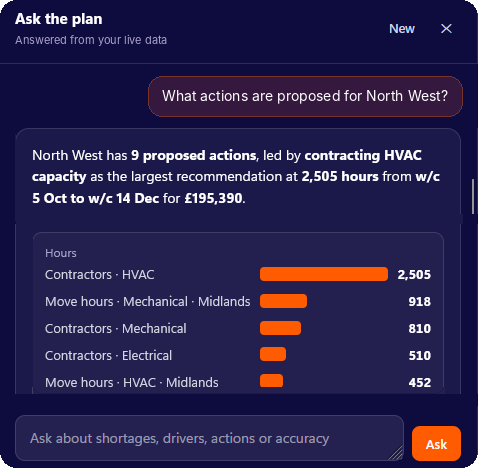
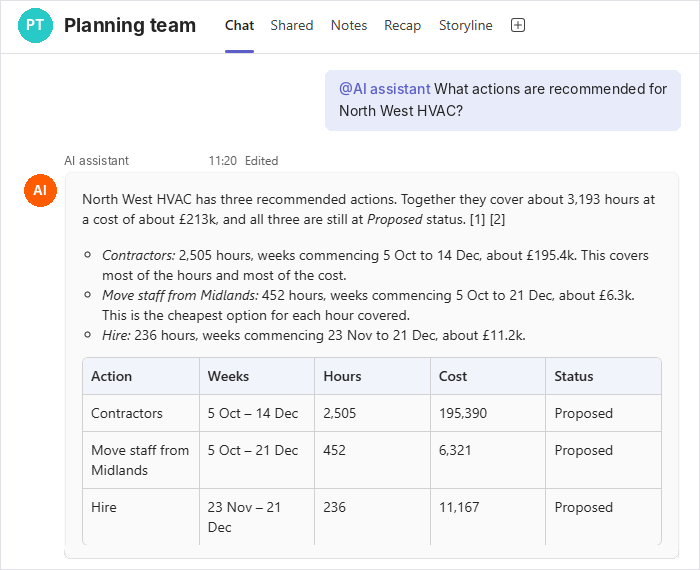
The last step is making all of this easy to reach. An AI assistant sits on the same governed data, so anyone can ask a question in plain English and get an answer, a chart and the query behind it. It only uses data that person is allowed to see.
It works where people already are: inside the report, or in Teams. In a Teams group chat, the whole team asks and builds on the same questions, so everyone plans from the same answer.
Within the report
Or on Teams
What it takes
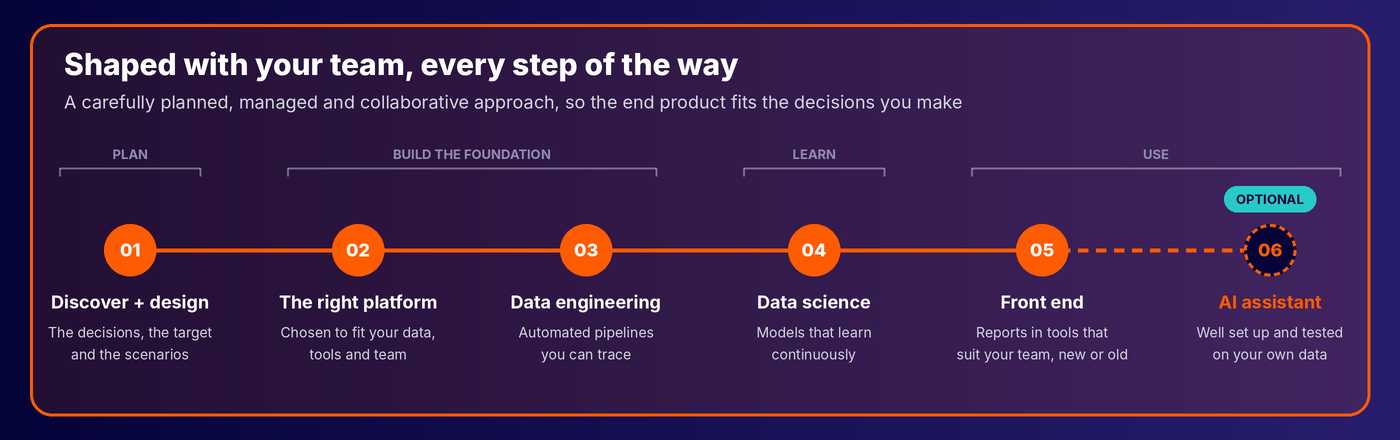
This isn’t a technology project handed over at the end. It’s a carefully planned, managed and collaborative approach. We work closely with your team from discovery and design, through choosing the right platform for your data, tools and people, to data engineering and continuously learning models. It ends in a front end that suits your team, new or already in use, and, if you want one, an AI assistant that is properly set up and tested on your data.
Get ahead
Back to Monday. The numbers look a few weeks ahead, not back at last month. You know the forecast is robust, because it has been thoroughly tested, and you can see what’s driving it. When the what if? comes, the answer takes minutes.
That’s what the right data platform makes possible: less time rebuilding the plan, more time acting on it.
Want to see what it could do with your data? We start small, with a short proof of value on your own history, measured against how you plan today.
Examples use synthetic data; figures are illustrative.